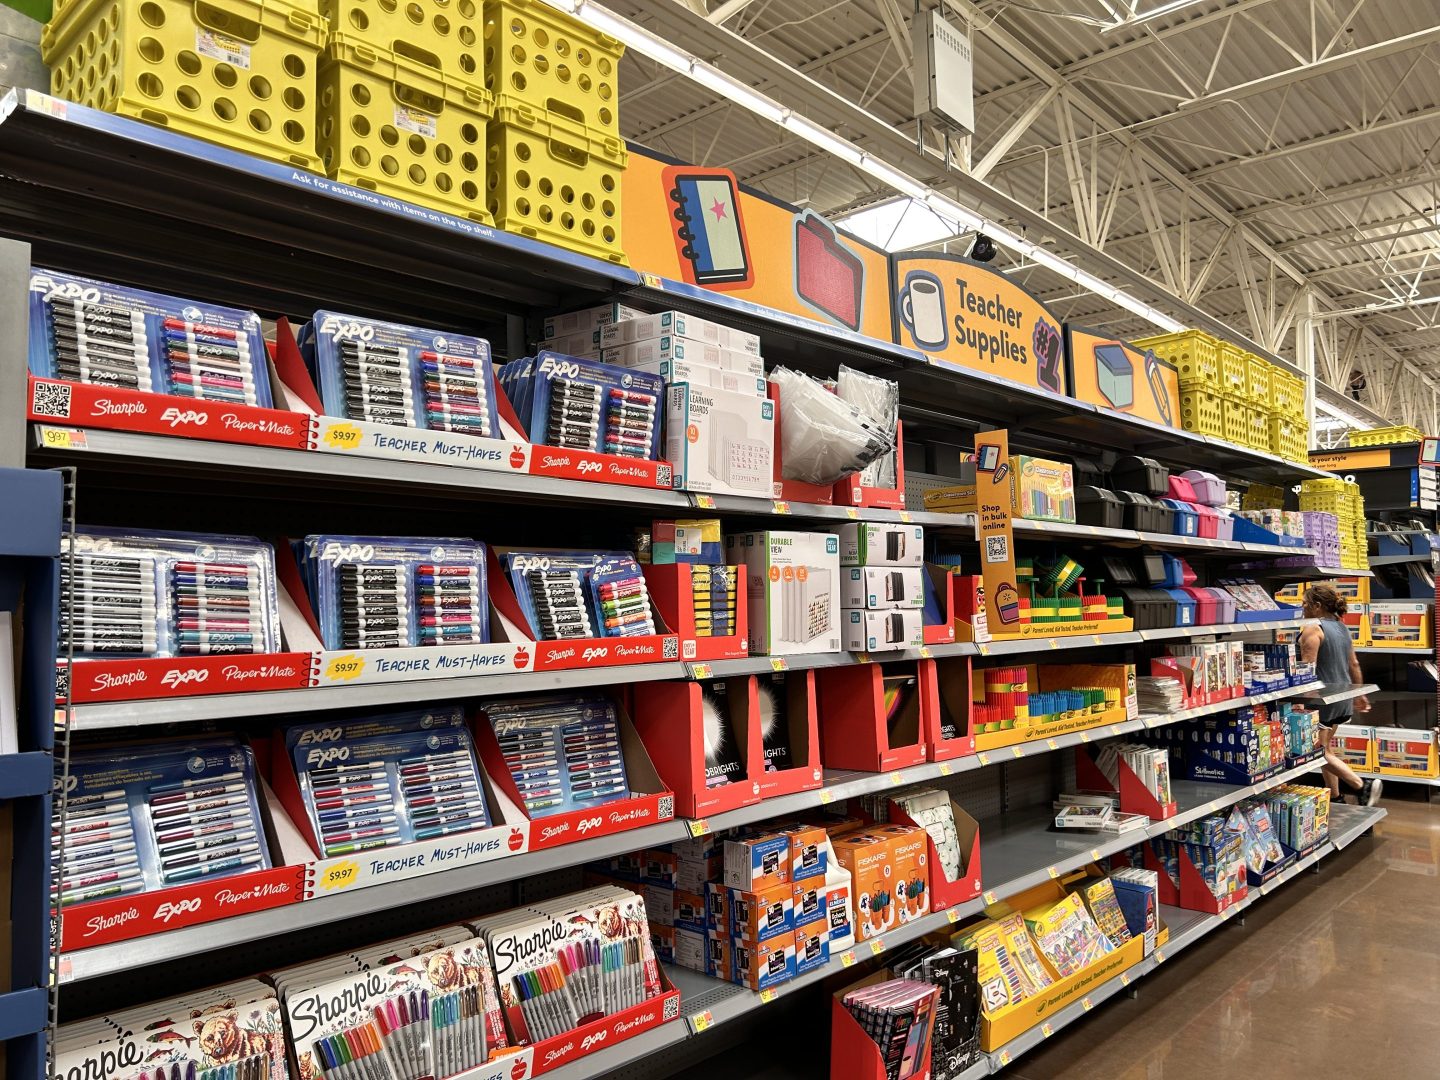
Companies Companies Newell Brands Newell Brands in Fortune Rankings Founded in 1903, Newell Brands designs, manufactures, sources, and distributes products in three main areas: home and commercial solutions, learning and development, and outdoor and recreation. Its home and commercial products include Rubbermaid, Crock-Pot, Mr. Coffee, Oster, and Yankee Candle, while its learning and development products consist of brands including Elmer's, Paper Mate, and Sharpie. In its outdoor and recreation segment, Newell provides products under the Coleman, Contigo, and Marmot brands. It distributes to warehouse clubs, department and drug/grocery stores, home centers, specialty retailers, office superstores and supply stores, e-commerce retailers, and sporting goods stores, as well as directly to consumers online.
Lindsey Nicholson—UCG/Universal Images Group/Getty Images
Company Information Fastest-growing Companies Revenue, Net Income Growth Rates And Ranks World's Most Admired Companies Key Financials (last Fiscal Year) Profit Ratios Earnings Per Share (last Fiscal Year) Total Return
Company Information Company Information Fastest-growing Companies Revenue, Net Income Growth Rates And Ranks World's Most Admired Companies Key Financials (last Fiscal Year) Profit Ratios Earnings Per Share (last Fiscal Year) Total Return Updated: 6/3/26 Country/Territory: U.S. Headquarters: Atlanta Industry: Home Equipment, Furnishings CEO: Christopher H. Peterson Website: https://www.newellbrands.com Ticker: NWL Company type: Public Revenues ($M): $7,204 Profits ($M): $-285 Market value ($M): $1,458 Number of employees: 21,900 Market value as of March 31, 2026.
Headquarters: Hoboken, N.J. Industry: Home Equipment, Furnishings Sector: Industrials Current Streak: 1 Years on List: 2 CEO: Michael Polk Website: https://www.newellbrands.com Revenue past four quarters ($M): $14,493 Net Income past four quarters ($M): $2,164 Revenue 3 Yr Growth Rank: 10 Revenue 3 Yr Annual Growth Rate: 49% EPS 3 Yr Growth Rank: 44 EPS 3 Yr Annual Growth Rate: 47% Total Return 3 Yr Rank: 99 Total Return 3 Yr Annual Rate: -13% Beat S&P 500 3 Yr Return: no Estimated P/E Ratio: 10 Sector: Consumer Products Industry: Home Equipment, Furnishings Current All-Star Rank: - Previous All-Star Rank: - Industry Rank: 5 Previous Industry Rank: 6 Overall Score: 6.65 Innovation: 5 People Management: 4 Use of Corporate Assets: 5 Social Responsibility: 4 Quality of Management: 6 Financial Soundness: 8 Long-Term Investment Value: 3 Quality of Products/Services: 6 Global Competitiveness: 4 $ millions % change Revenues ($M): $7,204 -5% Profits ($M): $-285 - Assets ($M): $10,715 - Total Stockholder Equity ($M): $2,391 - Profit as % of Revenues: -4% Profits as % of Assets: -2.7% Profits as % of Stockholder Equity: -11.9% Earnings Per Share ($): -0.70 EPS % Change (from prior fiscal year): - EPS % Change (5 year annual rate): - EPS % Change (10 year annual rate): - Total Return to Investors (last year): -60.6% Total Return to Investors (5 year, annualized): -26.2% Total Return to Investors (10 year, annualized): -18.7%
Newell Brands stock chart
Newell Brands in Fortune Rankings Fortune 500 World's Most Admired Companies Fortune Sector Leaders: Household Products 100 Fastest-Growing Companies
Fortune 500 Fortune 500 World's Most Admired Companies Fortune Sector Leaders: Household Products 100 Fastest-Growing Companies